Fast and reliable collision detection is an important component of every virtual reality system allowing motion of the objects which cannot interpenetrate with other objects in the virtual environment. In a typical situation, the geometry of objects is simple and ordinary collision detection techniques provide a binary response indicating whether or not the objects interpenetrate for their current configuration. If any interference region is found, further calculations are abandoned and other collisions are ignored. In our application the design of occlusal surface becomes more efficient if location and depth for all collisions are known. This means that a collision detection technique must handle all (multi-point) contacts and collisions between very complex objects (over 100,000 polygons are used to build a typical model of jaws) at interactive rates. Also, the penalty for contact complexity must be negligible in order to preserve constant response time. The algorithm cannot rely on space-time coherence with interference tests performed previously because the dentist can interactively change the position of the lower jaw. The requirements imposed on the complexity of objects and latency of response preclude using traditional collision detection algorithms running on sequential computers. We formulate the problem of collision detection in terms of depth calculations which are directly supported by graphics hardware. This strategy seems to be justified by the rapid increase in performance of rendering hardware. We have developed a technique called distance maps, which is based on standard features of graphics hardware such as a z-buffer and stencil buffer. Distance maps provide information about distance from one jaw to the opposite jaw along a chosen projection direction for sample points located on a raster grid of graphics hardware. We propose a technique based upon multi-projection distance maps, which collect information such as minimal distance for various projection directions. More technical details on our general purpose multi-points collision detection algorithm can be found in [MOK95]. In our dental application we extend the notion of distance maps to cumulative distance maps (CDM). A minimal distance can be calculated not only for multi-projection directions, but also for multiple positions of the lower jaw motion. CDM is a compact tool for representing depth and direction of all possible contacts/collisions encountered during motion of the jaw. Adjustment of the occlusal surface of restoration becomes simple with CDM. Vertices of mesh (or control points) describing a surface are moved the number of units specified in CDM in the direction of projection in which a collision is detected. Constraints imposed on the smoothness of the occlusal surface are used to prevent discontinuities and abrupt changes. Usually the sequence of CDM calculations followed by the adjustment of the surface must be repeated twice to remove completely all collisions.
The multi-projection technique can be used to accumulate more involved
characteristics of contacts between teeth than the discussed minimal
distance. For example, we found that the minimal distance
modulated by the dot product of the normal vector to the surface
with the vector in the projection direction approximates well
the load on teeth.
This and some more advanced characteristics
useful for evaluation of the grinding process we discuss
elsewhere [KMO 95]. The CDM with the load distribution
on restoration are also used for adjustments of the occlusal
surface until regions exhibiting too high load are removed.
95]. The CDM with the load distribution
on restoration are also used for adjustments of the occlusal
surface until regions exhibiting too high load are removed.
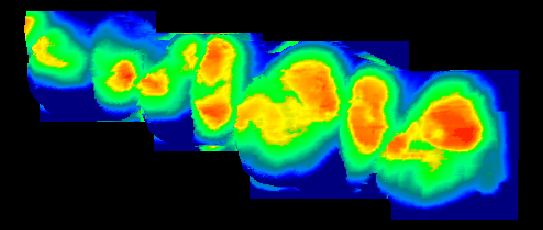
The time for calculation of the distance maps for a jaw model
composed of over 110,000 triangles is 0.22 sec on SGI's
Indigo Extreme workstation. Fig. 1
shows an example of distance
maps for the upper molar and premolar
teeth, calculated
for jaw position close to the centric occlusal position.
Regions marked by blue and green colors are those where the distance
to the opponent teeth exceeds 0.8mm;
colors between yellow and red correspond to distances below 0.8mm;
zero distance, i.e., contact between jaws is pure red.
Fig. 2 shows the CDM with the
load distribution for a molar tooth,
calculated for 5 loops of jaw motion. Regions of the highest load
are marked by red and yellow colors.
Extreme workstation. Fig. 1
shows an example of distance
maps for the upper molar and premolar
teeth, calculated
for jaw position close to the centric occlusal position.
Regions marked by blue and green colors are those where the distance
to the opponent teeth exceeds 0.8mm;
colors between yellow and red correspond to distances below 0.8mm;
zero distance, i.e., contact between jaws is pure red.
Fig. 2 shows the CDM with the
load distribution for a molar tooth,
calculated for 5 loops of jaw motion. Regions of the highest load
are marked by red and yellow colors.
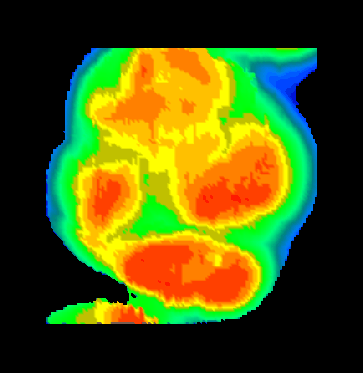
Figure 2: Cumulative distance maps